Second quarter earnings season, which winds down this week and next, has met some of the highest expectations. Strong beat rates, big upside earnings surprises, and increases in estimates during the past four weeks were consistent themes that gave investors very little to complain about. This is a big change from first quarter earnings season in April and May, which was more muddied by tariff uncertainty. What didn’t change this quarter? Artificial intelligence investment by mega cap technology was the key driver.
Strong Second Quarter Earnings Growth Despite Tariffs
As we wrote on August 11, companies have done a good job overall adjusting to tariffs so far, which was evident during earnings season. While several factors have helped mute the recent tariff effects, companies will experience more cost pressures in the months ahead. Markets got that message from the hotter-than-expected producer prices report on August 14.
Tariffs and some upward pressure on prices did not stop corporate America from delivering solid second quarter numbers. Some highlights:
- S&P 500 earnings per share (EPS) growth is tracking near 12%, more than double the sub-5% increase reflected in consensus estimates at quarter-end on June 30.
- S&P 500 revenue grew 6.3%, more than 2% above expectations at quarter-end.
- The average earnings upside surprise of 8.4% is better than we anticipated, even if it is slightly below the 5 year average (+9.1%). The 10-year average is +6.9%.
- A solid 81% of companies beat consensus EPS targets, above the 5-year average (78%).
- The revenue beat rate at 81% far exceeded the 5-year average (70%) and is among the highest ever recorded.
- The fastest earnings growth was generated by communication services (+45.3%), technology (+21.2%), and financials (+12.8%).
- Technology (15%), healthcare (+10.7%), and communication services (+9.7%) delivered the strongest revenue growth.
We also acknowledge the amount of upside was likely inflated by excessive analyst pessimism in April, as significant tariff threats likely lowered the bar more than usual. An unusually large currency boost also played a role, thanks to the weaker U.S. dollar, which boosts non-U.S. earnings. Despite these factors, the ability of corporate America to grow earnings at a double-digit pace in a slowing economy with so much trade uncertainty and high tariffs is impressive.
Not Much of a Tariff Dip Factored Into Earnings Estimates After Strong Q2
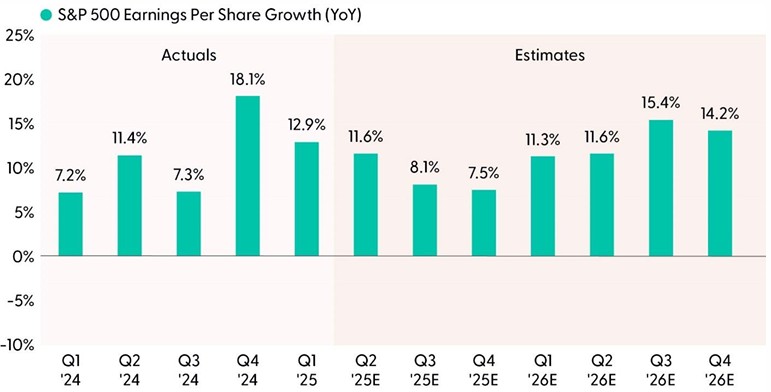
Source: LPL Research, FactSet, 08/14/25
Disclosures: All indexes are unmanaged and cannot be invested in directly. Estimates may not materialize as predicted and are subject to change.
Big Technology Remains the Key Growth Driver
One of the biggest positive surprises this earnings season has been the near-30% earnings growth from the Magnificent (Mag) Seven, while these so-called hyperscalers as a group increased their capital expenditures (capex) guidance for this year and next. Mag Seven capex is expected to increase by more than 40% in 2025 to over $380 billion and is expected to reach $460 billion in 2026. These huge investments support earnings because they are revenue for someone, and they help drive productivity gains and boost profit margins — not just for technology companies but for all of corporate America.
As shown in the “Magnificent Seven Still a Dominant Earnings Force” chart, this group continues to dominate the earnings growth of the rest of the companies in the index. This trend will likely continue through year-end before narrowing next year as the S&P 493 (the S&P 500 companies excluding the Mag Seven) plays some catch-up. This earnings growth gap is still huge right now, which underpins LPL Research’s continued preference for large growth equities over their large-value counterparts.
Magnificent Seven Still a Dominant Earnings Force
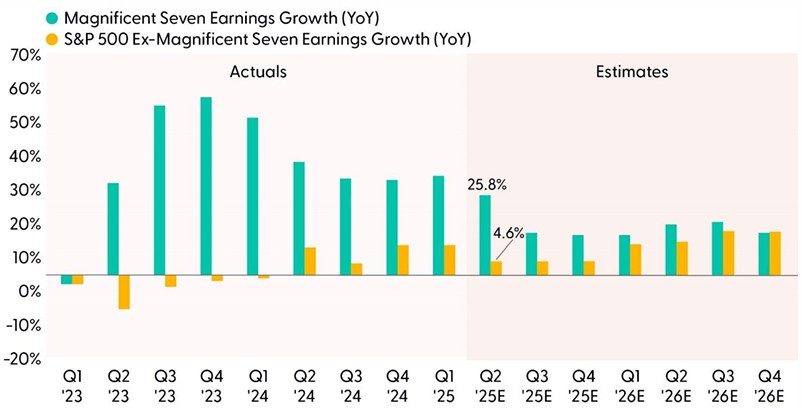
Source: LPL Research, Bloomberg, 08/14/25
Disclosures: Indexes are unmanaged and cannot be invested in directly. Estimates may not materialize as predicted and are subject to change. Magnificent Seven includes Alphabet (GOOG/L), Amazon (AMZN), Apple (AAPL), Meta (META), Microsoft (MSFT), NVIDIA (NVDA), and Tesla (TSLA).
Margin Outlook: Are Analysts Whistling Past the Graveyard?
This was the quarter when tariff effects were expected to show up. They have hit certain industries harder, particularly automakers. Other industries highlighting a sizable tariff drag include the following:
- Chemicals: Eastman Chemical (EMN)
- Consumer products: Procter & Gamble (PG) and Kimberly-Clark (KMB)
- Machinery: Caterpillar (CAT) and Deere (DE)
- Retail: Nike (NKE) and Amazon (AMZN)
- Luxury goods: Tapestry (TPR)
- Toys: Hasbro (HAS) and Mattel (MAT)
- Technology products: Apple (AAPL), HP (HPQ), and Dell (DELL)
This is not, by any stretch, a complete list. So, why haven’t these hits (and the many others) shown up in margins? First, most of the tariffs have not been fully felt yet, as discussed in detail here last week. In addition, some industries are largely unaffected — services businesses including banks, businesses sourcing domestically, and businesses that are not facing sectoral tariffs with supply chains in Canada and Mexico that are exempt under the USMCA trade agreement. Other actions taken to preserve margins include pressuring international suppliers, passing costs on to consumers, cost cuts, or AI-driven productivity enhancements, all of which have absorbed some of the impact.
More margin pressure is coming as more of these tariffs flow through in the months ahead, though how much remains to be seen. As evident in the “Companies Have Done Well Offsetting Initial Tariffs” chart that reflects continued margin expansion, Wall Street isn’t worried.
Companies Have Done Well Offsetting Initial Tariff Costs
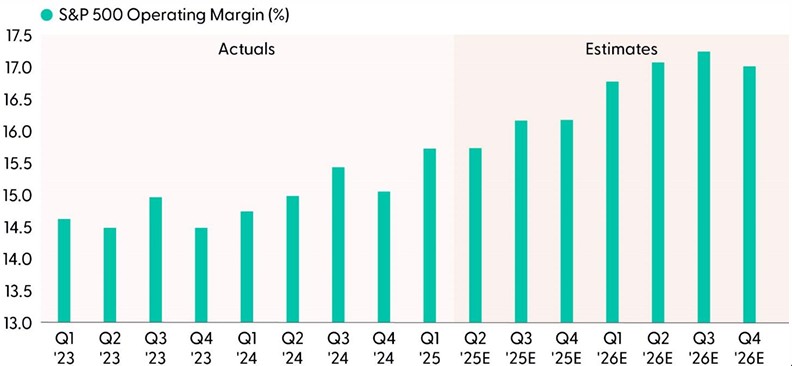
Source: LPL Research, Bloomberg, 08/14/25
Disclosures: Indexes are unmanaged and cannot be invested in directly. Estimates may not materialize as predicted and are subject to change.
How Much Confidence Should Investors Have in Rising 2026 Estimates?
Besides the big numbers put up by the mega cap technology companies, perhaps the most impressive achievement by corporate America during second quarter earnings might have been convincing analysts that earnings forecasts for this year and next were too low. A lowered bar during first quarter earnings season, a weak dollar, and a resilient U.S. economy all helped. But as the economy slows in the second half (if our economic forecasts prove correct) and more tariff costs are absorbed, the risk is that margins fall short of analysts’ optimistic expectations.
At the same time, the power of AI should not be underestimated. Earnings will get a boost in 2026 from the consumer tax cuts and business tax incentives in the so-called One Big Beautiful Bill. A growing economy will support corporate revenue growth. And getting past tariff uncertainty, even if additional costs come with it, will encourage more long-term investment.
Bottom line, despite a potential 2% or greater earnings hit from tariffs overall, LPL Research’s forecast for 6–7% earnings growth in 2025 and 2026 may be a bit low. Our $260 forecast for 2025 S&P 500 EPS (at the high end of our range) is probably a couple of dollars too low. For 2026, our $275 forecast may be $5 too low, if not more. Expect updated estimates shortly after NVIDIA (NVDA) reports results on August 27.
2025 and 2026 Earnings Estimates Have Impressively Risen During Earnings Season
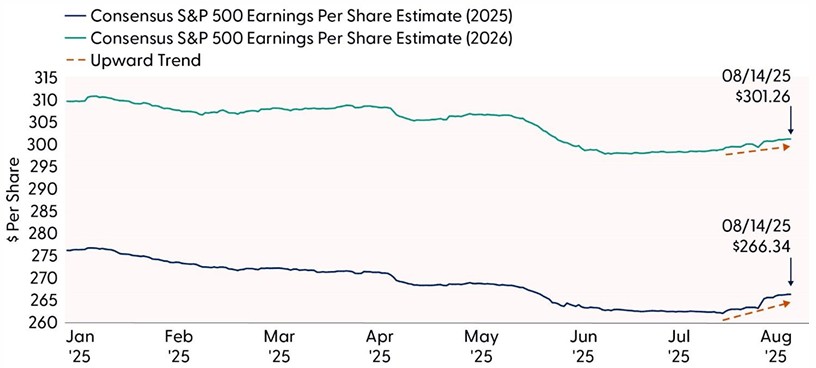
Source: LPL Research, FactSet, 08/14/25
Disclosures: Indexes are unmanaged and cannot be invested in directly. Estimates may not materialize as predicted and are subject to change.
Conclusion
Second quarter earnings season delivered a powerful message: corporate America remains remarkably resilient in the face of trade uncertainty and rising cost pressures. Despite the anticipated drag from tariffs, companies not only exceeded expectations but also raised guidance, driving upward revisions to earnings estimates for both 2025 and 2026. The standout performance from the Mag Seven continues to anchor overall earnings growth, with their aggressive AI-driven capital investment setting the stage for broader productivity gains across sectors.
While margin pressures from tariffs are likely to intensify in the coming months, many companies have proven adept at offsetting these costs through operational efficiencies, supplier negotiations, AI capabilities, and price adjustments. However, the muted impact on margins so far, as stocks have continued their rally, suggests some risk of complacency, particularly if market participants are surprised by how much this economy slows.
Going forward, the combination of AI-driven productivity, supportive fiscal policy, and easing trade uncertainty could push earnings growth beyond current forecasts. LPL Research’s current earnings estimates may prove conservative, especially if mega cap tech continues its spending splurge. With a lot of optimism priced into stocks, corporate America has delivered. Strong earnings momentum continues to support equities.
Asset Allocation Insights
LPL’s Strategic and Tactical Asset Allocation Committee (STAAC) maintains its tactical neutral stance on equities. Investors may be well served by bracing for occasional bouts of volatility given how much optimism is reflected in stock valuations, lingering tariff and inflation risks, and historical seasonal weakness. LPL Research advises against increasing portfolio risk beyond benchmark targets currently and continues to monitor trade negotiations, economic data, earnings, the bond market, and various technical indicators to identify a potentially more attractive entry point to potentially add equities on weakness.
The STAAC’s regional preferences across the U.S, developed international, and emerging markets (EM) are aligned with benchmarks. The Committee still favors growth over value, large caps over small caps, and the communication services and financials sectors.
Within fixed income, the STAAC holds a neutral weight in core bonds, with a slight preference for mortgage-backed securities (MBS) over investment-grade corporates. The Committee believes the risk-reward for core bond sectors (U.S. Treasury, agency MBS, investment-grade corporates) is more attractive than plus sectors. The Committee does not believe adding duration (interest rate sensitivity) at current levels is attractive and remains neutral relative to benchmarks.
Important Disclosures
This material is for general information only and is not intended to provide specific advice or recommendations for any individual. There is no assurance that the views or strategies discussed are suitable for all investors or will yield positive outcomes. Investing involves risks including possible loss of principal. Any economic forecasts set forth may not develop as predicted and are subject to change.
References to markets, asset classes, and sectors are generally regarding the corresponding market index. Indexes are unmanaged statistical composites and cannot be invested into directly. Index performance is not indicative of the performance of any investment and do not reflect fees, expenses, or sales charges. All performance referenced is historical and is no guarantee of future results.
Any company names noted herein are for educational purposes only and not an indication of trading intent or a solicitation of their products or services. LPL Financial doesn’t provide research on individual equities.
All information is believed to be from reliable sources; however, LPL Financial makes no representation as to its completeness or accuracy.
All investing involves risk, including possible loss of principal.
US Treasuries may be considered “safe haven” investments but do carry some degree of risk including interest rate, credit, and market risk. Bonds are subject to market and interest rate risk if sold prior to maturity. Bond values will decline as interest rates rise and bonds are subject to availability and change in price.
The Standard & Poor’s 500 Index (S&P500) is a capitalization-weighted index of 500 stocks designed to measure performance of the broad domestic economy through changes in the aggregate market value of 500 stocks representing all major industries.
The PE ratio (price-to-earnings ratio) is a measure of the price paid for a share relative to the annual net income or profit earned by the firm per share. It is a financial ratio used for valuation: a higher PE ratio means that investors are paying more for each unit of net income, so the stock is more expensive compared to one with lower PE ratio.
Earnings per share (EPS) is the portion of a company’s profit allocated to each outstanding share of common stock. EPS serves as an indicator of a company’s profitability. Earnings per share is generally considered to be the single most important variable in determining a share’s price. It is also a major component used to calculate the price-to-earnings valuation ratio.
All index data from FactSet or Bloomberg.
This research material has been prepared by LPL Financial LLC.
Not Insured by FDIC/NCUA or Any Other Government Agency | Not Bank/Credit Union Guaranteed | Not Bank/Credit Union Deposits or Obligations | May Lose Value
For public use.
Member FINRA/SIPC.
RES-0005028-0725 Tracking #783611 | #784394 (Exp. 08/26)


 Ask a Question